Centralize analytics tracking
Transform the data from your processes, documents, and signatures into informed decisions for your business
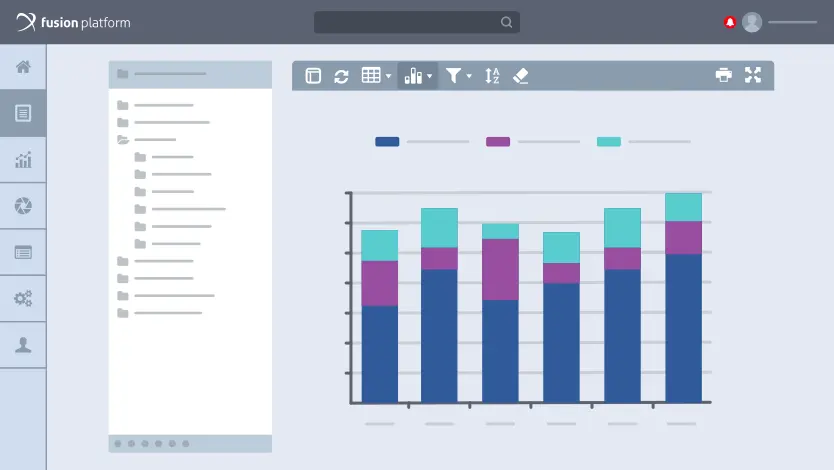
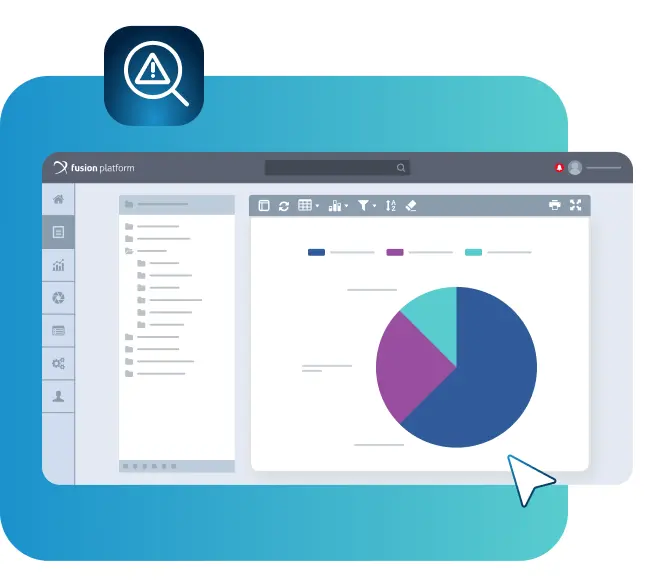
Take control of all analysis in one place
Centralize detailed data from all platform modules and quickly create dashboards, reports, and indicators. This enables you to transform information into powerful insights, making it easier to make strategic decisions that drive your business growth.
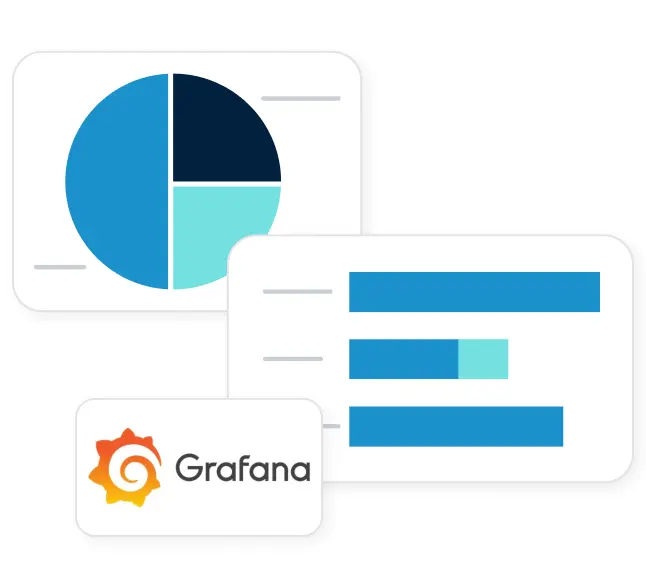
Reduce the time spent on analyses with the Grafana Dashboard
Access an additional layer of statistical analysis and data visualization with the Grafana Dashboard integration. Monitor, analyze, and optimize projects more effectively, with real-time visualizations and a consolidated view of all your KPIs.
Visualize, compare, and identify bottlenecks in your operations
Easily identify areas for improvement in your operations by visualizing and comparing real-time data. With interactive graphs and indicators, you can spot bottlenecks, optimize processes, and make quick, assertive decisions to enhance the performance and efficiency of your business.
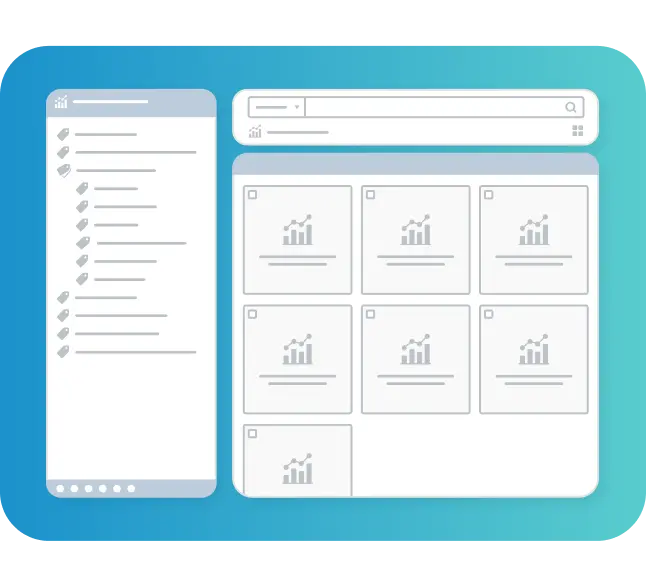
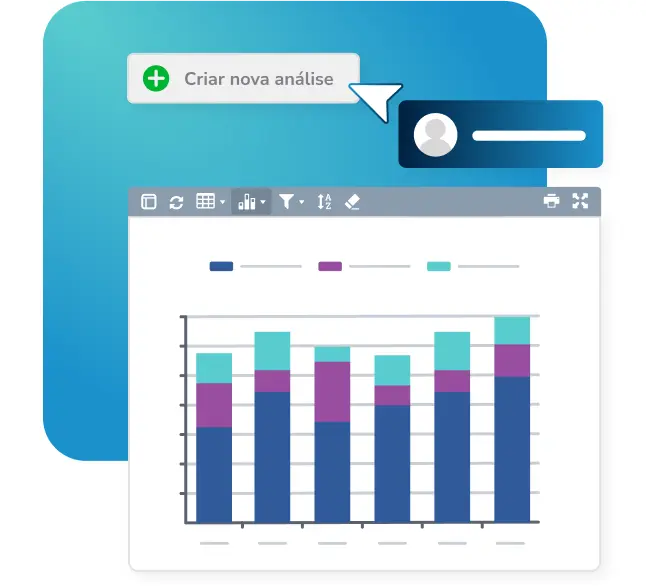
Customizable Analyses
Create analyses tailored to your business needs, delivering relevant and strategic data that truly drive your results.
Transforming businesses across various industries
With Fusion Platform, we are almost totally independent and our team is able to solve almost all the problems right away, customizing and creating the new process, which is one of the biggest benefits of the tool.

Tomáš Jancov
IT Manager at Nidec Global Appliance

We have the confidence that, if we re-plan the future of Orsegups, reaching greater results, new challenges, we will be supported by a reliable, solid supplier that has been proving, for a long time, that is capable of supplying our needs.
Giliardi dos Santos
IT Manager at Orsegups

It’s a gain of information, because you have much more access to saved information from past processes and control of time. When it comes to managing people, there was a huge gain in agility in activities and processes. In this next phase, we will automate these processes, and the employees’ time savings will be enormous, the system will do everything automatically.
Fernando Felipe
Global Business Developer at H. Edigio Group

Because it’s a solution that gives us the flexibility to develop, it’s easy to monitor and make adjustments. As automation requests come in, our team can build the workflows and implement the necessary changes.
Support Analyst
 Fernando Drevek
What are you waiting for?
Fusion Platform can transform your company and deliver the results you’ve always wanted.